Blende Project
Click to view the Blende Zn-Pb-Ag Deposit, Yukon -- Virtual TourDeposit Model
The Blende deposit is a Proterozoic-aged carbonate-hosted massive sulphide deposit with features of both Irish-type and clastic-dominated Zn--Pb deposits (M.Moroskat et.al., Mineral Deposita 2014) and is the largest carbonate-hosted Zn-Pb-Ag deposit in Yukon (M. Robinson and C.I. Godwin, Economic Geology 1995).
Project Location and Ownership
The 100% owned Blende Property consists of 260 quartz mining claims (5,434 hectares) that surrounds Mt. Williams, 64 km north of Keno Hill, Yukon Territory.� The Property is centred on a >6 km mineralized corridor that hosts a number of carbonate-hosted Zn-Pb-Ag deposits on the south edge of the Mackenzie Platform, hosted by Middle Proterozoic Gillespie Group dolomite.
In 2005, Blind Creek was granted an option to acquire a 60% interest in the Blende property from Eagle Plains Resources. This 60% has been earned with the completion of $5 million in exploration expenditures on the Blende property, paying $250,000 in cash and the issuance of 1,000,000 common shares of the Company. In November 2008, the remaining 40% of the Blende property was purchased by Blind Creek in return for the issuance of 4,500,000 common shares of the Company. An underlying 3% net smelter royalty remains on the Blende property, 2% of which can be purchased for $2 million.
Historic Work
In the early 1990s, Billiton Resources Canada Inc. conducted exploration work that delineated two mineralized zones on the Blende property. The Blende Deposit was outlined at surface by an open-ended 5 kilometre long soil anomaly with zinc values up to 1%. Billiton drilled 77 holes on the property, totaling > 14,000 meters over 3.2 kilometers of strike length, reporting numerous high-grade intercepts at relatively shallow depths. Subsequent step-out drilling by NDU Resources confirmed the continuation of ore-grade mineralization westward, with the addition of significant copper values.
On the basis of diamond drilling and surface trenching, Historical Mineral Resources for the East and West zone were estimated by Billiton as follows:
Historical Mineral Resource Blende Property, YT Billiton 1991 |
||||
Zone |
Historical Resource (tonnes) |
Zinc (%) |
Lead (%) |
Silver (grams/tonne) |
West Zone |
15,300,000 |
3.04 |
3.23 |
67.5 |
East Zone |
4,300,000 |
3.05 |
1.31 |
15.1 |
TOTALS |
19,600,000 |
3.04 |
2.80 |
56.0 |
Note: The tonnage and grade estimates were prepared by Billiton Canada Explorations Inc. prior to the introduction of National Instrument 43-101; there is no current feasibility or pre-feasibility study. A qualified person has not done sufficient work to classify the historical estimate as current mineral resources or mineral reserves, the Company is not treating the historical estimate as current mineral resources or mineral reserves and the historical estimate should not be relied upon.
In 2006-2008, Eagle Plains Resources and Blind Creek completed an additional 45 holes for 8,700 meters of drilling. This work when added to the drill programmes that preceded it bring the total historical drilling completed on the Blende property to 132 drill holes totaling 25,192 meters.
Numerous high-grade intersections or wide lower-grade intercepts have been reported by past operators, including (amongst others of lower value):
| DDH |
Zone |
From (m) |
To (m) |
Length (m) |
Pb (%) |
Zn (%) |
Pb+Zn (%) |
Ag (g/t) |
Cu (%) |
B88-002 |
West |
8.84 |
14.94 |
6.1 |
9.31 |
7.84 |
17.15 |
140.26 |
|
B88-002 |
West |
70.71 |
90.53 |
19.82 |
12.29 |
4.44 |
16.73 |
284.85 |
|
B88-003 |
West |
117.96 |
135.94 |
17.98 |
10.13 |
3.7 |
13.83 |
319.57 |
|
Including |
117.96 |
119.5 |
1.52 |
25.8 |
9.67 |
35.47 |
1724.57 |
||
B90-004 |
West |
53.64 |
68.64 |
15 |
6.42 |
3.95 |
10.37 |
57.46 |
|
B90-005 |
West |
73.66 |
88.9 |
15.24 |
4.95 |
5.18 |
10.13 |
91.28 |
|
B90-006 |
West |
68.73 |
91.64 |
22.91 |
7.97 |
2.52 |
10.49 |
113.16 |
|
B90-009 |
West |
15 |
26.92 |
11.92 |
7.14 |
8.2 |
15.34 |
118.74 |
|
B90-015 |
West |
35 |
69.55 |
34.55 |
7.77 |
3.68 |
11.45 |
196.41 |
|
B91-038 |
East |
98.5 |
122.5 |
24 |
1.37 |
3.78 |
5.15 |
10.07 |
|
B91-047 |
West |
145.56 |
150.88 |
5.32 |
4.82 |
11.19 |
16.01 |
64.75 |
|
B91-047 |
150.88 |
180.9 |
30.02 |
1.14 |
4.65 |
5.79 |
35.23 |
||
B91-047 |
180.9 |
189 |
8.1 |
3.07 |
12 |
15.07 |
102.35 |
||
B91-060 |
West |
261.41 |
269.3 |
7.89 |
0.44 |
0.08 |
0.52 |
501.26 |
|
Including |
261.41 |
263.3 |
1.89 |
1.28 |
0.21 |
1.49 |
1532.57 |
||
B91-068 |
East |
31.9 |
60.3 |
28.4 |
4.43 |
3.84 |
8.27 |
42.14 |
|
B94-081 |
9.24 |
33.5 |
24.26 |
6.68 |
3.72 |
10.4 |
158.09 |
0.5 |
|
Including |
Far West |
9.24 |
24.1 |
14.86 |
10.06 |
5.64 |
15.7 |
235.96 |
0.8 |
Also Including |
11.9 |
18.5 |
6.6 |
17.25 |
7.48 |
24.73 |
304.7 |
0.63 |
|
BE06088 |
East |
37.46 |
82.4 |
44.94 |
1.98 |
3.9 |
5.88 |
34.8 |
|
BE07116 |
Far West |
10.9 |
11.9 |
1 |
15.2 |
7.58 |
22.78 |
193 |
|
BE08126 |
West |
96 |
99 |
3 |
8.82 |
7.8 |
16.62 |
259 |
|
BE08128 |
Far West |
27.9 |
49.5 |
21.6 |
3.4 |
2.05 |
5.45 |
52.85 |
0.44 |
Including |
31.4 |
34.2 |
2.8 |
15.32 |
5.02 |
20.34 |
201.57 |
1.11 |
|
BE08131 |
Far West |
35.7 |
38.7 |
3 |
8.05 |
4 |
12.05 |
187 |
|
BE08131 |
41.2 |
43.8 |
2.6 |
10.26 |
2.46 |
12.72 |
102.96 |
*Widths are core widths and are not true widths which are not precisely known.
2017 Exploration Summary
- Engaged Moose Mountain Technical Services (MMTS) to collect metallurgical test work samples and prepare a NI 43-101 Technical Report and Mineral Resource Estimate for the Blende Project.
- Commissioned metallurgist Frank Wright, P.Eng. to direct and oversee Blende Project metallurgical test work studies.
- Conducted consultation with Na-Cho Ny�k Dun First Nation.
- Applied for and received 5-year Class 4 Quartz Mining Approval and 2 Year Land Use Permits.
2018 NI 43-101 Mineral Resource Estimate
On April 11, 2018 Blind Creek announced the Maiden Blende NI 43-101 Mineral Resource Estimate consisting of 32.98MT at 5.03% ZINC EQ INFERRED PLUS 3.65MT at 5.18% ZINC EQ INDICATED*.
Table 1. Base Case Mineral Resource (at NSR cutoff grade of $CDN39.35 (ZnEq=2%))
Category |
Cutoff |
In situ |
In situ Grades |
In situ Metal Content |
|||||||
ZnEq |
Tonnage |
ZnEq |
Zn |
Pb |
Ag |
NSR |
OXRAT |
Zn |
Pb |
Ag |
|
�(%) |
(ktonnes) |
�(%) |
�(%) |
�(%) |
(gpt) |
($CDN/t) |
(Mlbs) |
(Mlbs) |
(koz) |
||
Indicated |
2.0 |
3,650 |
5.18 |
1.98 |
1.95 |
35.7 |
101.87 |
0.08 |
159 |
157 |
4,192 |
Inferred |
2.0 |
32,980 |
5.03 |
2.01 |
1.88 |
32.0 |
98.91 |
0.22 |
1,461 |
1,364 |
33,980 |
*Moose Mountain Technical Services NI 43-101 Resource Estimate and Technical Report dated May 25th, 2018.
While a direct comparison with the historic 1991 Billiton resource estimate is not possible owing to differences in the drill hole database, cutoff grade, metal prices, estimated metal recoveries, payables and resource classification, it is clear that subsequent infill and extensional drilling by Blind Creek, coupled with recent metallurgical results and have had a very positive effect on the Blende Mineral Resource.�Previous evaluations of the property have focused on the open-pit potential recovering only the sulphide minerals. "Results from recent metallurgical test work indicates Blende mineralogy will respond well to standard process techniques" -- Frank Wright, P.Eng., F.Wright and Associates. �Zinc and Lead oxide results and recoveries have been incorporated in the new Blende Mineral Resource Estimate.
The Blende Project is a potential bulk tonnage, open pit approach that offers some distinct cost advantages to other advanced Pb/Zn projects in Canada, which are typically underground. Blende Resource mineralization outcrops at surface, is confined to 2 pit shapes approximately 2 kilometres apart (view map) and remains open in areas northwest, southeast and below the "reasonable prospects of economic extraction" open pit shapes. Blind Creek is positioning to conduct a significant drill program in 2019 to test these potential open pit extensions and step out from mineralized drill hole intercepts at the adjacent Far West, Central, Far East and Shanghai Zones within the >6 kilometre-long Blende mineralized corridor. Further metallurgical testing and sampling will be undertaken to provide for a near-term Preliminary Economic Assessment to evaluate future mine planning, metallurgy and project economics."
Tables 2 and 3 below summarize the Blende deposit Indicated and Inferred Resource, respectively, at varying ZnEq cutoffs with the Base Case highlighted at 2% ZnEq (NSR=$CDN39.35).
Table 2. Blende Deposit Indicated Mineral Resource
Pit Area |
Cutoff |
In situ |
In situ Grades |
In situ Metal Content |
|||||||
ZnEq |
Tonnage |
ZnEq |
Zn |
Pb |
Ag |
NSR |
OXRAT |
Zn |
Pb |
Ag |
|
�(%) |
(ktonnes) |
�(%) |
�(%) |
�(%) |
(gpt) |
($CDN/t) |
(Mlbs) |
(Mlbs) |
(koz) |
||
West Pit |
1.5 |
2,852 |
5.18 |
1.69 |
2.06 |
41.7 |
101.97 |
0.09 |
106 |
129 |
3,827 |
2.0 |
2,585 |
5.54 |
1.78 |
2.21 |
45.0 |
108.93 |
0.10 |
102 |
126 |
3,740 |
|
2.5 |
2,300 |
5.94 |
1.88 |
2.38 |
49.0 |
116.95 |
0.10 |
95 |
121 |
3,623 |
|
3.0 |
2,015 |
6.40 |
1.99 |
2.58 |
53.6 |
125.90 |
0.10 |
88 |
114 |
3,472 |
|
3.5 |
1,733 |
6.91 |
2.11 |
2.79 |
59.1 |
136.02 |
0.10 |
81 |
106 |
3,295 |
|
4.0 |
1,472 |
7.47 |
2.23 |
3.02 |
65.5 |
147.07 |
0.10 |
72 |
98 |
3,100 |
|
5.0 |
1,061 |
8.63 |
2.39 |
3.53 |
80.6 |
169.80 |
0.11 |
56 |
83 |
2,750 |
|
East Pit |
1.5 |
1,231 |
3.97 |
2.30 |
1.19 |
11.9 |
78.19 |
0.06 |
62 |
32 |
470 |
2.0 |
1,068 |
4.31 |
2.45 |
1.32 |
13.2 |
84.79 |
0.06 |
58 |
31 |
452 |
|
2.5 |
855 |
4.83 |
2.64 |
1.56 |
15.3 |
94.94 |
0.06 |
50 |
29 |
422 |
|
3.0 |
647 |
5.49 |
2.84 |
1.89 |
18.5 |
108.06 |
0.07 |
41 |
27 |
384 |
|
3.5 |
487 |
6.23 |
3.02 |
2.28 |
22.3 |
122.55 |
0.07 |
32 |
25 |
350 |
|
4.0 |
387 |
6.87 |
3.14 |
2.66 |
25.9 |
135.25 |
0.08 |
27 |
23 |
322 |
|
5.0 |
288 |
7.71 |
3.24 |
3.20 |
30.6 |
151.75 |
0.08 |
21 |
20 |
283 |
|
Total |
1.5 |
4,083 |
4.82 |
1.87 |
1.80 |
32.7 |
94.80 |
0.08 |
169 |
162 |
4,297 |
2.0 |
3,654 |
5.18 |
1.98 |
1.95 |
35.7 |
101.87 |
0.08 |
159 |
157 |
4,192 |
|
2.5 |
3,155 |
5.64 |
2.08 |
2.16 |
39.9 |
110.98 |
0.09 |
145 |
150 |
4,044 |
|
3.0 |
2,662 |
6.18 |
2.19 |
2.41 |
45.1 |
121.56 |
0.09 |
129 |
141 |
3,856 |
|
3.5 |
2,220 |
6.76 |
2.31 |
2.68 |
51.1 |
133.07 |
0.09 |
113 |
131 |
3,645 |
|
4.0 |
1,859 |
7.35 |
2.42 |
2.95 |
57.3 |
144.60 |
0.10 |
99 |
121 |
3,422 |
|
5.0 |
1,349 |
8.43 |
2.57 |
3.46 |
69.9 |
165.95 |
0.10 |
76 |
103 |
3,032 |
|
Table 3. Blende Deposit Inferred Mineral Resource
Pit Area |
Cutoff |
In situ |
In situ Grades |
In situ Metal Content |
|||||||
ZnEq |
Tonnage |
ZnEq |
Zn |
Pb |
Ag |
NSR |
OXRAT |
Zn |
Pb |
Ag |
|
�(%) |
(ktonnes) |
�(%) |
�(%) |
�(%) |
(gpt) |
($CDN/t) |
(Mlbs) |
(Mlbs) |
(koz) |
||
West Pit |
1.5 |
32,533 |
4.87 |
1.85 |
1.87 |
32.4 |
95.85 |
0.25 |
1,325 |
1,343 |
33,900 |
2.0 |
29,538 |
5.19 |
1.96 |
2.00 |
34.7 |
102.09 |
0.24 |
1,278 |
1,300 |
32,955 |
|
2.5 |
26,623 |
5.51 |
2.07 |
2.12 |
37.1 |
108.41 |
0.24 |
1,217 |
1,245 |
31,773 |
|
3.0 |
23,293 |
5.90 |
2.20 |
2.28 |
40.3 |
116.17 |
0.23 |
1,128 |
1,172 |
30,185 |
|
3.5 |
20,037 |
6.34 |
2.32 |
2.47 |
43.9 |
124.66 |
0.23 |
1,024 |
1,089 |
28,306 |
|
4.0 |
16,815 |
6.83 |
2.44 |
2.69 |
48.4 |
134.42 |
0.22 |
903 |
998 |
26,166 |
|
5.0 |
11,695 |
7.87 |
2.63 |
3.18 |
58.8 |
154.82 |
0.22 |
678 |
819 |
22,105 |
|
East Pit |
1.5 |
4,296 |
3.27 |
2.21 |
0.74 |
8.1 |
64.28 |
0.06 |
209 |
70 |
1,123 |
2.0 |
3,441 |
3.64 |
2.42 |
0.85 |
9.3 |
71.66 |
0.06 |
183 |
65 |
1,024 |
|
2.5 |
2,552 |
4.13 |
2.67 |
1.02 |
10.9 |
81.18 |
0.06 |
150 |
57 |
894 |
|
3.0 |
1,658 |
4.87 |
3.00 |
1.32 |
13.8 |
95.91 |
0.06 |
110 |
48 |
736 |
|
3.5 |
1,113 |
5.68 |
3.26 |
1.71 |
17.4 |
111.81 |
0.07 |
80 |
42 |
621 |
|
4.0 |
778 |
6.53 |
3.46 |
2.18 |
21.3 |
128.45 |
0.07 |
59 |
37 |
532 |
|
5.0 |
493 |
7.73 |
3.64 |
2.93 |
27.9 |
152.13 |
0.08 |
40 |
32 |
443 |
|
Total |
1.5 |
36,829 |
4.68 |
1.89 |
1.74 |
29.6 |
92.17 |
0.22 |
1,534 |
1,413 |
35,022 |
2.0 |
32,979 |
5.03 |
2.01 |
1.88 |
32.0 |
98.91 |
0.22 |
1,461 |
1,364 |
33,980 |
|
2.5 |
29,175 |
5.39 |
2.13 |
2.02 |
34.8 |
106.03 |
0.22 |
1,367 |
1,302 |
32,668 |
|
3.0 |
24,951 |
5.84 |
2.25 |
2.22 |
38.5 |
114.82 |
0.22 |
1,238 |
1,220 |
30,921 |
|
3.5 |
21,150 |
6.30 |
2.37 |
2.43 |
42.5 |
123.99 |
0.22 |
1,104 |
1,131 |
28,927 |
|
4.0 |
17,594 |
6.82 |
2.48 |
2.67 |
47.2 |
134.15 |
0.21 |
962 |
1,035 |
26,699 |
|
5.0 |
12,188 |
7.86 |
2.67 |
3.17 |
57.5 |
154.71 |
0.21 |
718 |
851 |
22,548 |
|
Mineral resources are not mineral reserves and do not have demonstrated economic viability. There is no certainty that mineral resources will be converted into mineral reserves.
Mineral Resource Estimate ZnEq Cutoff Sensitivity (Base Case 2% ZnEq)
Notes for Tables 1, 2 and 3
- The Mineral Resource Estimate in this disclosure is estimated by Moose Mountain Technical Services (MMTS), an independent mining consulting company.
- The effective date of this Mineral Resource Estimate is March 27, 2018 and includes all Blende Property drill and trench results to the end of 2017.
- This Mineral Resource Estimate represents an increase over the previous Historic (1991) Billiton resource estimate. This is primarily due to additional drilling and increased metal prices, as well as higher confidence in the recoveries due to recent metallurgical testing of both oxide and sulfide material. This deposit has an average oxide content of 21% which allows for recovery of both sulfides and oxides at the recoveries used in this Resource Estimate
- The Historic (1991) Billiton resource estimate was based upon 80 diamond drill holes with assay data. A total of 119 diamond drill holes with assay data and 11 trenches with channel sampling were used in the MMTS Blende NI 43-101 Mineral Resource Estimate. An additional 13 holes drilled in 1991 in the periphery of the deposit were not used in the Mineral Resource Estimate.
- Mineral Resources are not Mineral Reserves and do not have demonstrated economic viability.
- The Mineral Resource Estimate follows Canadian Institute of Mining, Metallurgy and Petroleum (CIM) standards definitions and guidelines.
- There are no known environmental, permitting, legal, title, taxation, socio-economic, marketing, political, or other relevant factors that could materially affect the Mineral Resource Estimate.
- The Resource has been constrained by "reasonable prospects for eventual economic extraction" open pits. This was done by creating a Lerchs-Grossman optimized pit using the prices, recoveries, payables and costs as stated below. No penalties were included.
- The Equivalent Zn and NSR metal price assumptions of: $US1.20/lb Zn, $US1.00/lb Pb, and $US19.00/oz Ag and an exchange rate of US$0.80 = $1CDN. Metal recoveries are based on metallurgical studies done in 2017 on both the oxide and sulfides material, and are: 70% Zn, 85% Pb and 90% Ag (10% to Zn concentrate and 80% to Pb concentrate). Payables based on comparable smelter terms and a 3% Net Smelter Return (NSR) Royalty are; 85% Zn, 95% Pb and 80% Ag.
- Mining costs used for the "reasonable prospects of economic extraction" pit shapes are $CDN1.88/tonne for all material within the potential open pits. Processing, G&A, Surface Services and Tailings costs used have a total of $CDN37.50/tonne material milled. Costs are based on comparable Zn-Pb-Ag projects in North America. The exchange rate is US$0.80 = $1CDN. Open pit slopes are 45 degrees.
- The Zinc Equivalent (ZnEq) calculation uses the assumed prices, recoveries and payables resulting in the following equation:
- Internal dilution is accounted for in the block model by calculating whole block grades on 6mx6mx6m blocks.
- Quality Assurance/Quality Control (QA/QC) has been reviewed in 2013 and again in 2018 by MMTS and is considered to industry standards.
- Geologic domains are modelled based on faulting, lithology and grade distribution. Four domains have been modelled, with assays composted to 3m intervals honoring domain boundaries and capped by domain based on cumulative probability plots. Zn, Pb and Ag grades have been interpolated using Ordinary Kriging (OK).
- Indicated Resources must contain at least two drill holes within 30m of the block. Inferred Resources have at least 2 drill holes within 120% of the Variogram Range, with extrapolation of the data limited.
- Density values are based on a correlation of (Zn+Pb) grades and re-assayed intervals from a sampling program undertaken in the summer of 2017.
*Moose Mountain Technical Services NI 43-101 Resource Estimate and Technical Report dated May 25th, 2018.
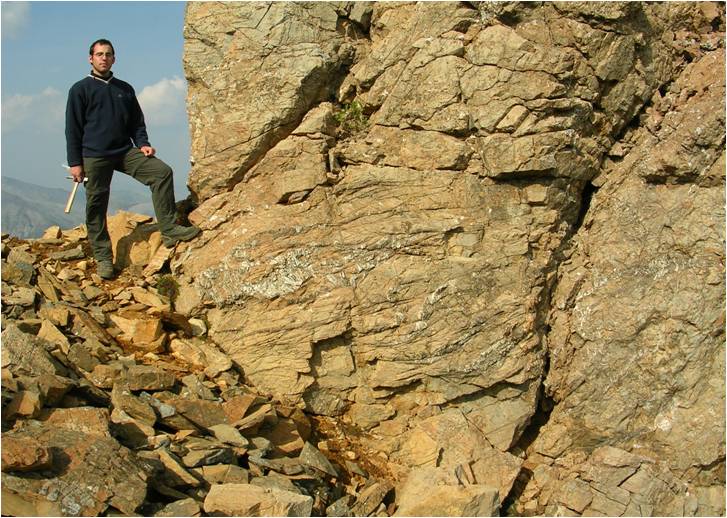
Project Geology
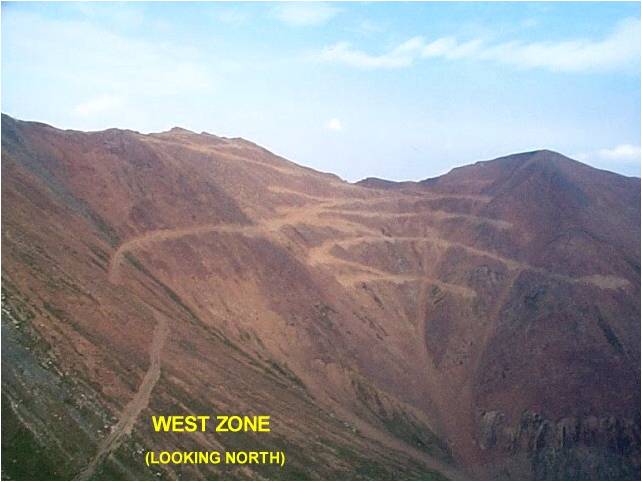
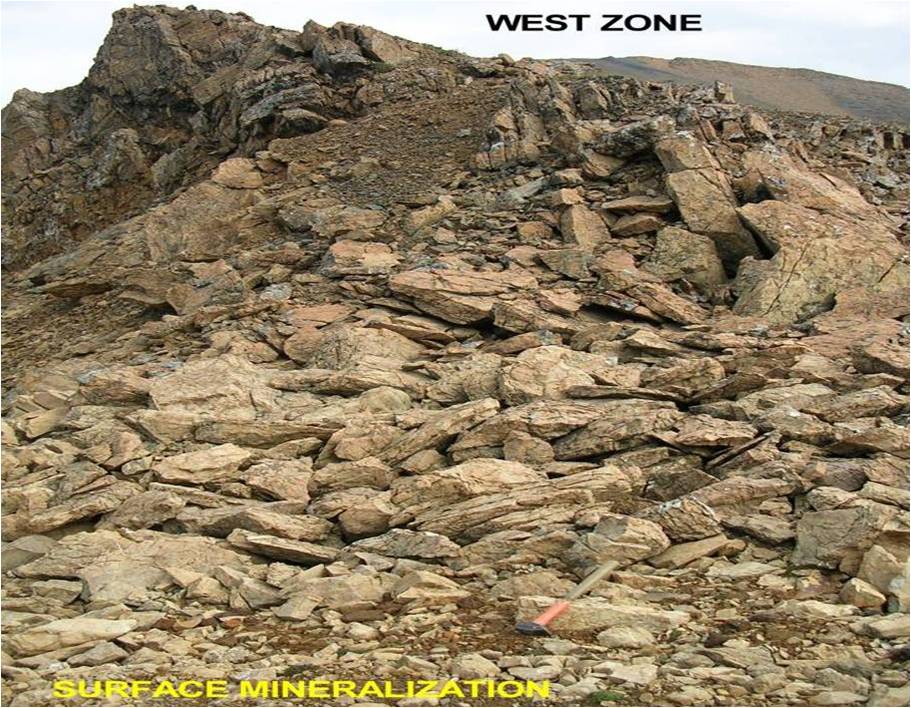
The Blende zinc-lead-silver deposit is a large, structurally controlled, breccia-hosted system. The deposit is tabular and dips steeply to the southeast, cutting bedding approximately at moderate to high angles. Mineralization occurs intermittently along the structural zone for about 8 km and is present across widths of up to 200 m. Mineralization consists of yellow, fine to coarse sphalerite and galena. Other sulphide minerals include pyrite and minor chalcopyrite plus tetrahedrite. The surface expression of the deposit is characterised by soil anomalies of up to 10,000 ppm (1%) zinc.
Mineralization
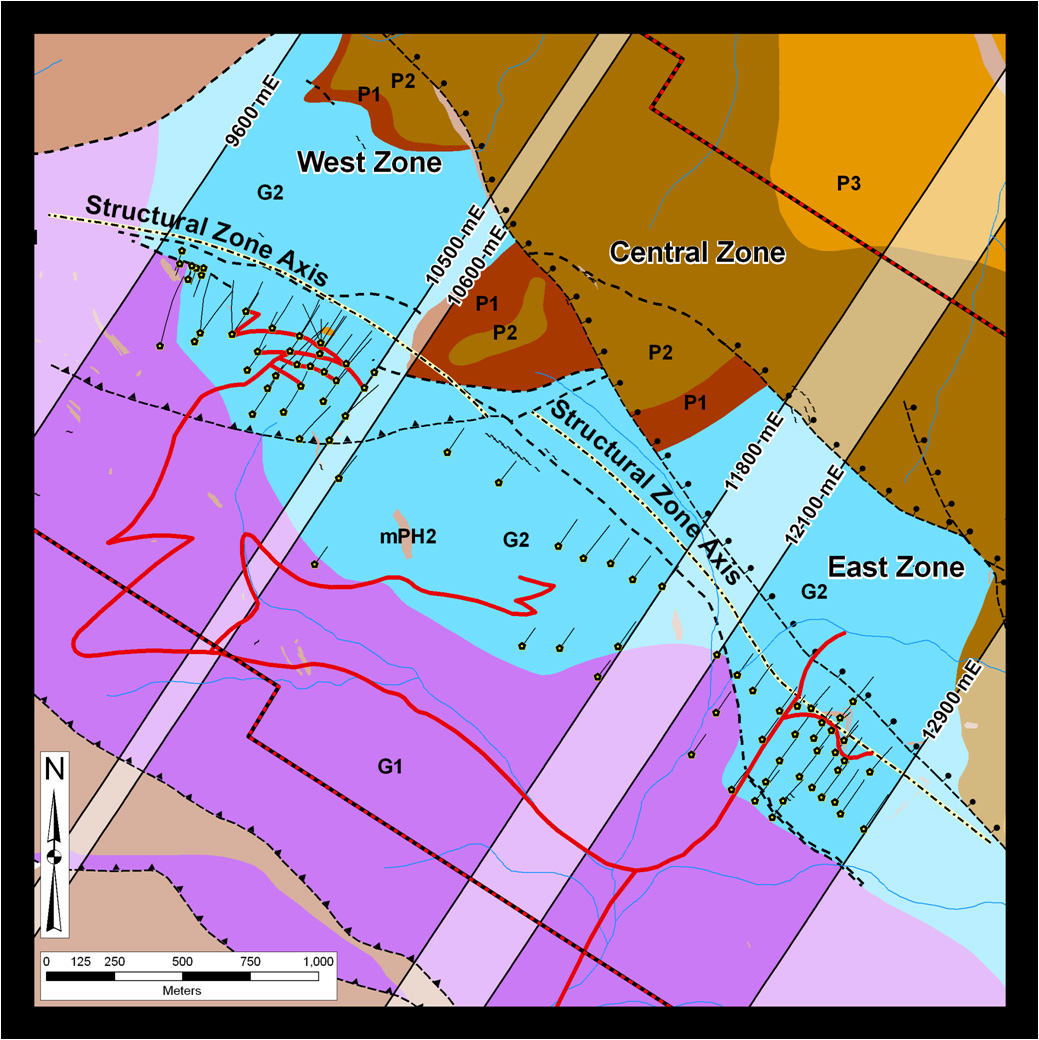
The 8 km long Blende mineralized trend is defined by a number of zones that occur along the axial surface trend of the Blende Antiform. The trend is bound to the east by the virtually unexplored Far East zone and to the west by the promising Far West zone.
Zinc and lead mineralization occurs in five main areas on the Blende Property. From west to east the mineralized zones are named: Far West, West, Central, East and Far East. The principal minerals containing the zinc and lead are sphalerite (ZnS) and galena (PbS) but weathering has converted a significant amount of the near surface sulphide to smithsonite (zinc carbonate) and anglesite (lead carbonate). High silver values are associated with tetrahedrite but one occurrence of native silver was found in drill core in the East zone. Highest silver values, however, tend to come from the West zone.
A number of high grade silver intercepts were seen in some of the deeper holes but these appear to be unrelated to any significant lead-zinc content. The possibility exists for zonation at the property, and deeper favourable limy horizons may be present. In addition, copper rich zones, particularly at the lesser-explored west end of the West Zone area, may indicate further lateral zonation associated with mafic sills. Step-out drilling in 1994 confirmed the continuation of good-grade mineralization westward from the previous limit of the West zone, with the addition of significant copper values:
- Hole 94-81 contained 14.9 m of mineralization assaying 228.4 g/t (6.66 oz/t) silver, 9.71% lead, 5.48% zinc and 0.78% copper from 9.2m to 24.1 m
- Hole 94-84 contained 8.5 m of mineralization assaying 136.1 g/t (3.97 oz/t) silver, 6.74% lead, 3.65% zinc and 2.43% copper from 45.5 m to 54 m
Exploration Program
Blind Creek is positioning to conduct a significant drill program in 2019 to test potential open pit extensions and step out from mineralized drill hole intercepts at the adjacent Far West, Central, Far East and Shanghai Zones within the >6 kilometre-long Blende mineralized corridor. Further metallurgical testing and sampling will be undertaken to provide for a near-term Preliminary Economic Assessment to evaluate future mine planning, metallurgy and project economics
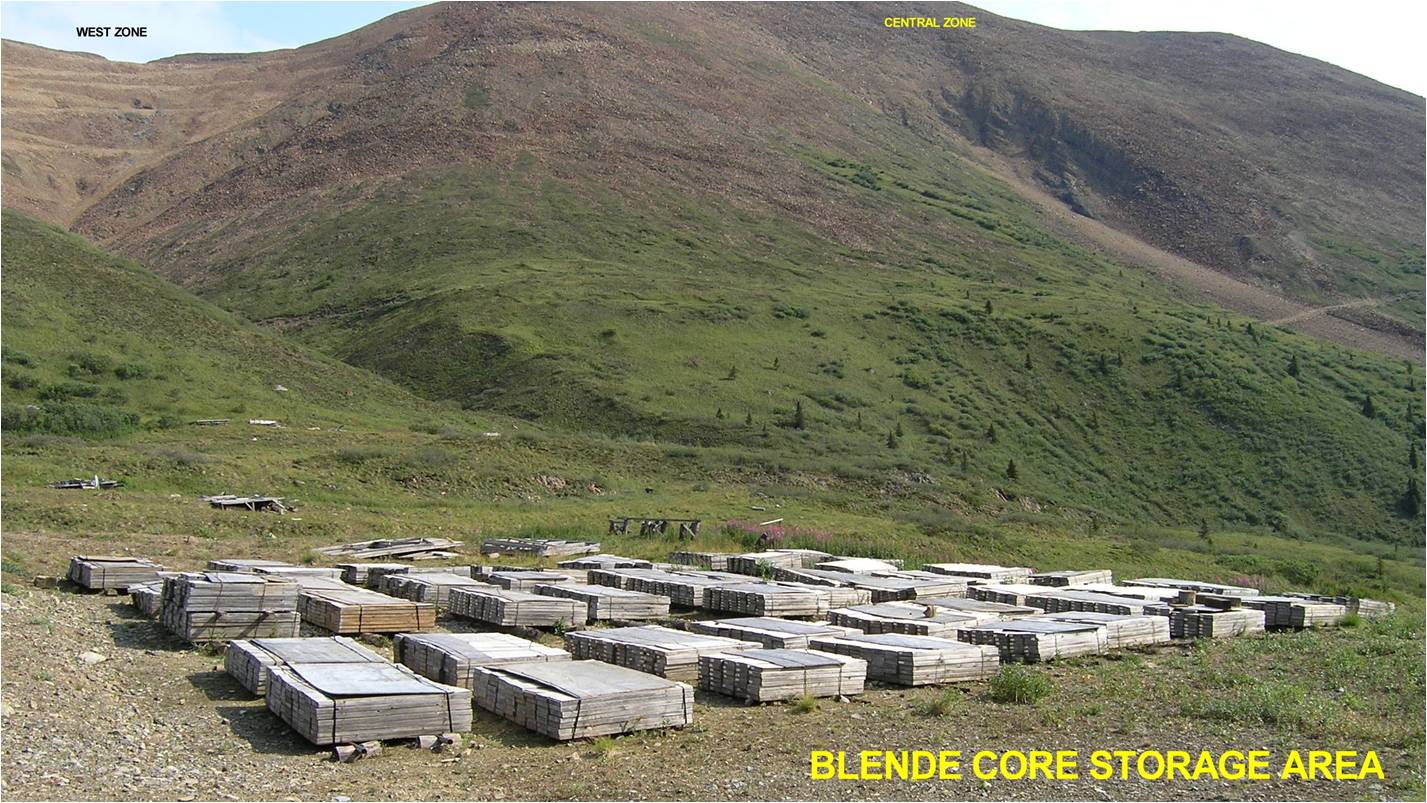
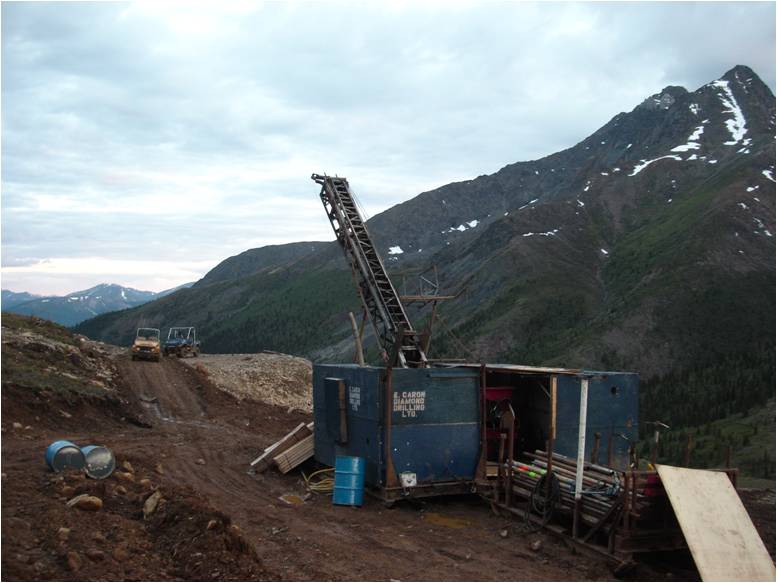
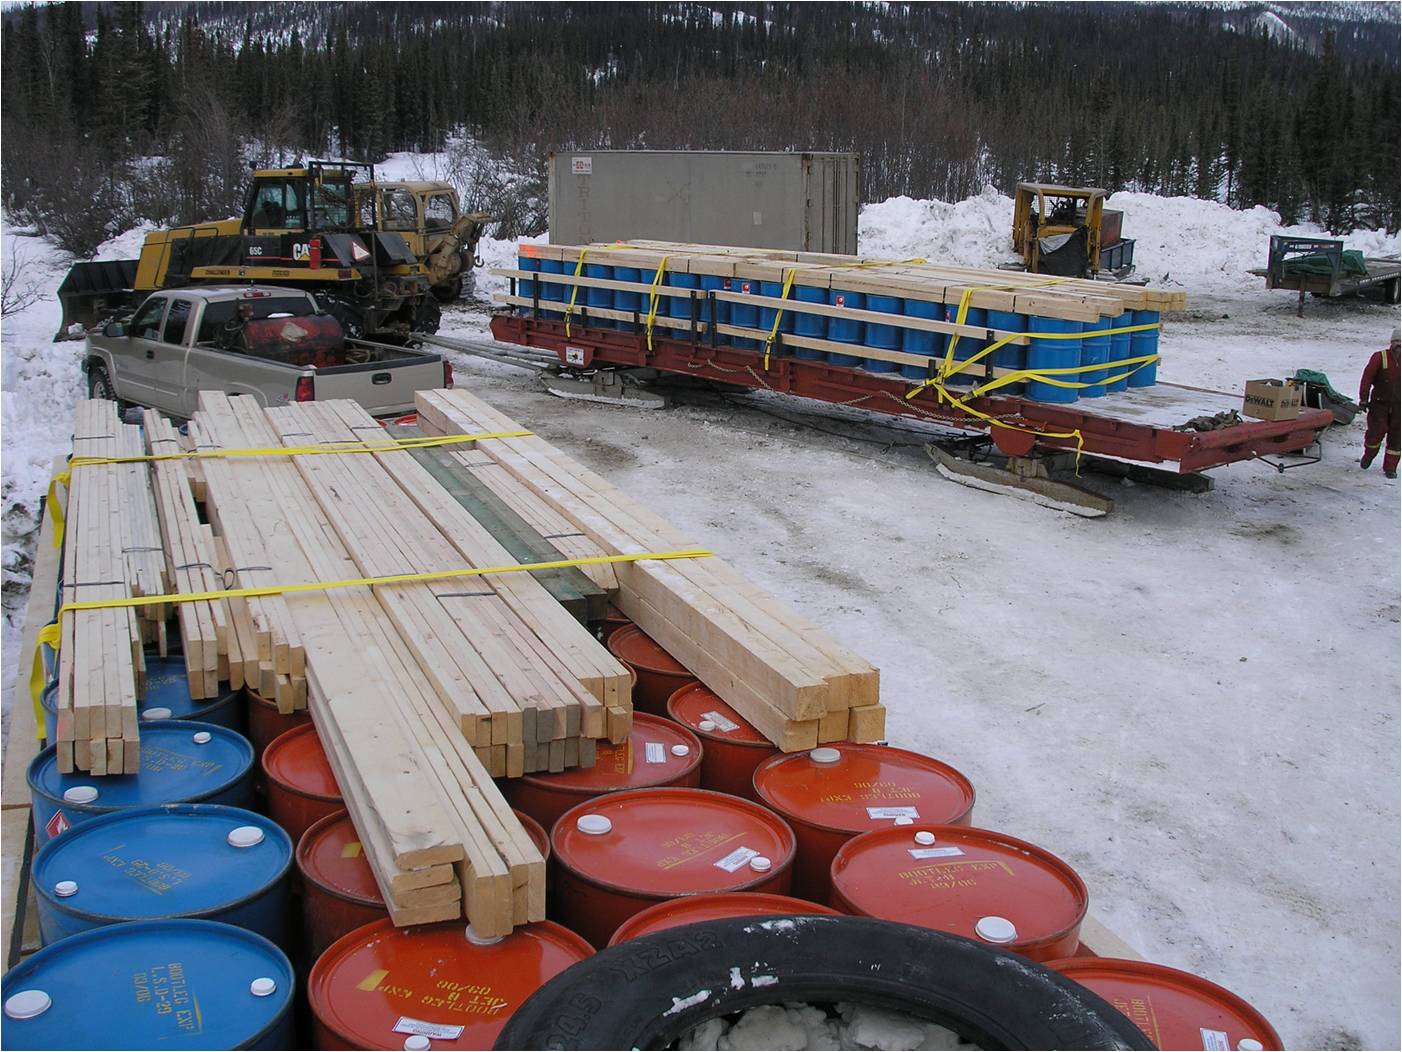
Photos


* Please refer to cautionary note
**A qualified person has not done sufficient work to classify the historical estimate as current mineral resources or mineral reserves, the Company is not treating the historical estimate as current mineral resources or mineral reserves and the historical estimate should not be relied upon
Technical Reports
- Blende NI 43-101 Mineral Resource Technical Report - May 2018
- Assessment Report on Field Work Within the BCR-Blende Project, Quartz Clkaims X15-40 - June 2012
- 2011 Technical Report Blende Project
- Technical Report Blende Project - December 10, 2009
- Technical Report Blende Project - August 14, 2007
- Technical Report Blende Project - February 24 2006
- Technical Report Blende Project - November 14, 2005
- Technical Report Blende Project - August 15, 2004
- Assessment Report Blende Project - January 30, 2003
- 2007 Diamond Drilling, Geological and Geochemical Report Vol. 1 - February 2008
- 2007 Diamond Drilling, Geological and Geochemical Report Vol. II - Appendices I - IV
- 2007 Diamond Drilling, Geological and Geochemical Report Vol. III - Appendices V - VI
- Blende Property Option Agreement - July 19, 2005
- Conceptual Design Brief and Plans for new Airstrip at Blende Property - October 2007
- Diamond Drilling, Geological and Geochemical Report - Volume II - Appendices - February 2007
* Please refer to cautionary note
**A qualified person has not done sufficient work to classify the historical estimate as current mineral resources or mineral reserves, the Company is not treating the historical estimate as current mineral resources or mineral reserves and the historical estimate should not be relied upon
Geological Maps and Sections
Blende Property Geology, 2018 Resource Pit Outlines and Exploration Targets
Drill Hole and Zone Locations

Geological Section

Geology

Local Geology

Property Tenure 2

Property Tenure

Regional Map

Stratigrpahic Column

West Zone - Geological Section
 Winter Road Access
* Please refer to cautionary note
**A qualified person has not done sufficient work to classify the historical estimate as current mineral resources or mineral reserves, the Company is not treating the historical estimate as current mineral resources or mineral reserves and the historical estimate should not be relied upon